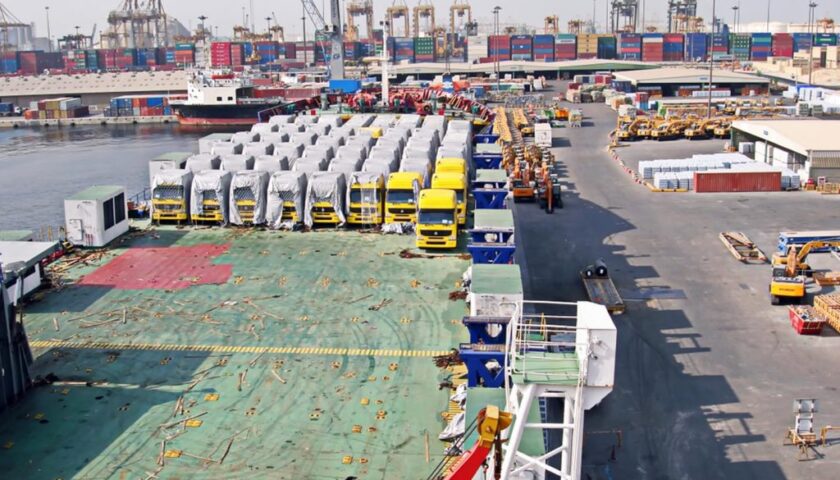
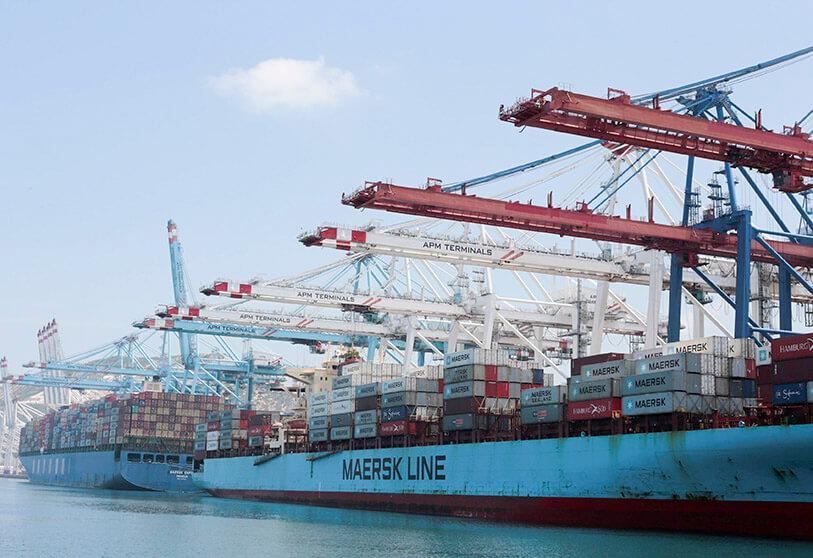
A report into container port performance last year has thrown into relief recent efficiency gains achieved by seaports in the Middle East, with four facilities in the region making cut in the global top five.
The report/research, which was compiled by the World Bank and S&P Global Market Intelligence, the Container Port Performance Index 2021 ranks facilities based on the time vessels needed to spend in port to complete workloads over the course of 2021, “a year that saw unprecedented port congestion and disruption to global supply chains.”
“Saudi Arabia’s King Abdullah Port [ranked first] in 2021, with regional competitors Salalah Port in Oman, Hamad Port in Qatar, and Khalifa Port in Abu Dhabi rounding out the top five. Saudi Arabia’s Jeddah Islamic Port also featured strongly in eighth place overall,” a joint statement by the two research teams said.
While the report is an invaluable tool for industry stakeholders, its findings represent a snapshot of the upending of well-oiled container port activity around the world caused by congestion at U.S. west- and east-coast ports during the peak of the Covid-19 dislocation.
“Increasing the use of digital technology and green fuel alternatives are two ways countries can modernise their ports and make maritime supply chains more resilient,” said Martin Humphreys, lead transport economist at the World Bank and one of the researchers behind the index.
“Inefficient ports represent a significant risk for many developing countries in that they can hinder economic growth, harm employment, and increase costs for importers and exporters. In the Middle East, heavy investments in container port infrastructure and technology are proving to be effective.”
Middle East port sources have informed Seatrade Maritime News that recent Drewry research showed that in 2021, capacity utilisation at Middle East ports fell to 57per cent, from 66per cent in 2016, indicating that several Middle facilities may have installed too much capacity for their near-term requirements.

Three Chinese ports made the top 10, including Shanghai (Yangshan), Ningbo and the southern port of Guangzhou, while last year’s most efficient port—Yokohama in Japan—fell to 10th place overall.
“The pandemic highlighted in stark terms the pivotal role port performance plays in the timely supply of goods to countries and their populations,” said Turloch Mooney, associate director, maritime and trade, at S&P Global Market Intelligence.
“The effects of the pandemic on key global gateways and associated supply chains are very worrying and continue to cause severe supply delays and shortages of goods, leading to higher prices and negatively impacting the financial situation of many companies.”
US ports were identified as stragglers in the report’s rankings. The Port of Virginia was the top-ranked port in North America in 23rd position, followed by Miami (29) and Canada’s Halifax (46).
However, the ephemeral nature of the research is pointed up by information from satellite data provider, Spire Global, showing that while the maximum weekly average delay to terminal at the Port of Los Angeles was over eight days in the past six months, average delays on May 25 were zero minutes.
“More than four-fifths of global merchandise trade by volume are carried by sea, and approximately 35 per cent of total volumes and over 60per cent of commercial value is shipped in containers,” the CPPI said.
“The Moroccan port of Tanger-Med, in 6th place, was the highest ranked port in Europe and North Africa. Cartagena in Colombo (12) ranked highest in Latin America and the Caribbean, while Port Matadi in the Democratic Republic of Congo (171) is the best performing port in Sub-Saharan Africa.”
The CPPI is based on total port hours per ship call, defined as the elapsed time between when a ship reaches a port to its departure from the berth having completed its cargo exchange, the researchers explained.
“Greater or lesser workloads are accounted for by examining the underlying data within 10 different call-size ranges. Five distinct ship size groups are accounted for in the methodology given the potential for greater fuel and emissions savings on larger vessels.”


